Data Analyst & BI ATS Resume Template
Jake's Single-Column Format
A single-column Data Analyst & BI sample in the Jake's Resume layout, with X-Y-Z bullets and keywords to compare against a job description.
Nearest BLS wage, checked October 6, 2026: Data scientists, May 2025 median pay $120,230.
Occupational Outlook Handbook. Many postings titled “data analyst” are not classified as data scientists. The nearest Handbook occupation is data scientists, SOC 15-2051. Use this median as context for that occupation, not as the wage for every analyst job. This is not a FairCV survey.
Interactive Template Preview
Jake's Resume-Inspired Layout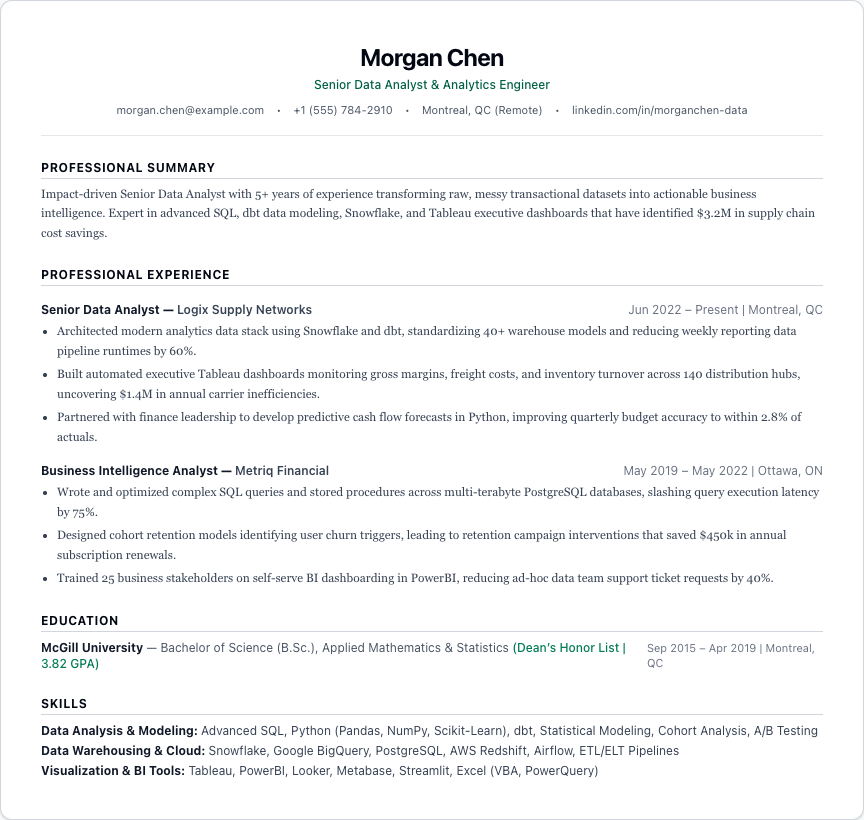
Morgan Chen
Senior Data Analyst & Analytics Engineer
Professional Summary
Impact-driven Senior Data Analyst with 5+ years of experience transforming raw, messy transactional datasets into actionable business intelligence. Expert in advanced SQL, dbt data modeling, Snowflake, and Tableau executive dashboards that have identified $3.2M in supply chain cost savings.
Professional Experience
- Architected modern analytics data stack using Snowflake and dbt, standardizing 40+ warehouse models and reducing weekly reporting data pipeline runtimes by 60%.
- Built automated executive Tableau dashboards monitoring gross margins, freight costs, and inventory turnover across 140 distribution hubs, uncovering $1.4M in annual carrier inefficiencies.
- Partnered with finance leadership to develop predictive cash flow forecasts in Python, improving quarterly budget accuracy to within 2.8% of actuals.
- Wrote and optimized complex SQL queries and stored procedures across multi-terabyte PostgreSQL databases, slashing query execution latency by 75%.
- Designed cohort retention models identifying user churn triggers, leading to retention campaign interventions that saved $450k in annual subscription renewals.
- Trained 25 business stakeholders on self-serve BI dashboarding in PowerBI, reducing ad-hoc data team support ticket requests by 40%.
Education
Skills
Pre-populate your work history and export unwatermarked PDFs for $4 flat. No monthly subscriptions.
Ten terms from the Data Analyst & BI example
These ten terms were chosen from the example posting on this page on October 6, 2026. The list is a starting point for that sample. It is not a study of applicant tracking systems, and it is not a ranking of what recruiters scan for. Paste a real posting into the matcher on the homepage to see which terms already appear on your resume.
Open the builder and paste a real posting into the keyword matcher. The sample list above is only the starting point.
Example job description
Original example written by FairCV on October 6, 2026. It is not an employer job ad.
Data analyst, logistics reporting
Fieldline Freight is hiring a data analyst to rebuild weekly operations reporting. The stack is advanced SQL against Snowflake and BigQuery, dbt data modeling for the shared warehouse, and executive dashboards in Tableau or Power BI. Python with Pandas and NumPy is used when a number needs a check the warehouse model cannot do.
You will keep ETL and ELT pipelines from slipping, and you will explain a statistical analysis in a sentence an operator can use. One current project is A/B test evaluation on the dispatch screen. Another is cohort and retention modeling for shippers who leave after the first month.
Wage note from the Handbook
The Handbook lists median pay of $120,230 in May 2025. The same page lists the 10th percentile at $67,240 and the 90th percentile at $199,130.
Source, checked October 6, 2026: Data scientists in the Occupational Outlook Handbook.
Google X-Y-Z Bullet Point Breakdown
How Google hiring executives recommend structuring resume bullets: "Accomplished [X] as measured by [Y], by doing [Z]".
Why this line is specific: Combines current modern data stack (Snowflake/dbt) with tangible efficiency gains.
Why this line is specific: Demonstrates that the candidate turns data into executive operational savings.
Why this line is specific: Proves high-level database querying capabilities beyond basic SELECT statements.
⚠️Common Mistakes for Data Analyst & BIs
- ×Listing SQL without describing data volume (e.g. terabytes, millions of rows).
- ×Focusing only on dashboards without highlighting business decisions influenced by the data.
- ×Using visual skill rating meters (e.g., "SQL: 5/5 stars") which ATS parsers cannot read.
✓Hiring Manager Recommendations
- ✓Include a dedicated Projects section showcasing a GitHub repo or public Tableau Public profile.
- ✓Quantify the size of the datasets you work with (e.g. "10M+ daily events", "140 distribution centers").
- ✓Explicitly separate Data Engineering skills (dbt, ETL) from Data Visualization tools (Tableau, PowerBI).
Ready to Export Your Data Analyst & BI Resume?
Start editing immediately in our clean visual builder. No monthly recurring traps, no surprise credit card bills. $4 flat single export or $14 for 30 days.